
In the article below, we’ll analyze the Pure Quant tool results.
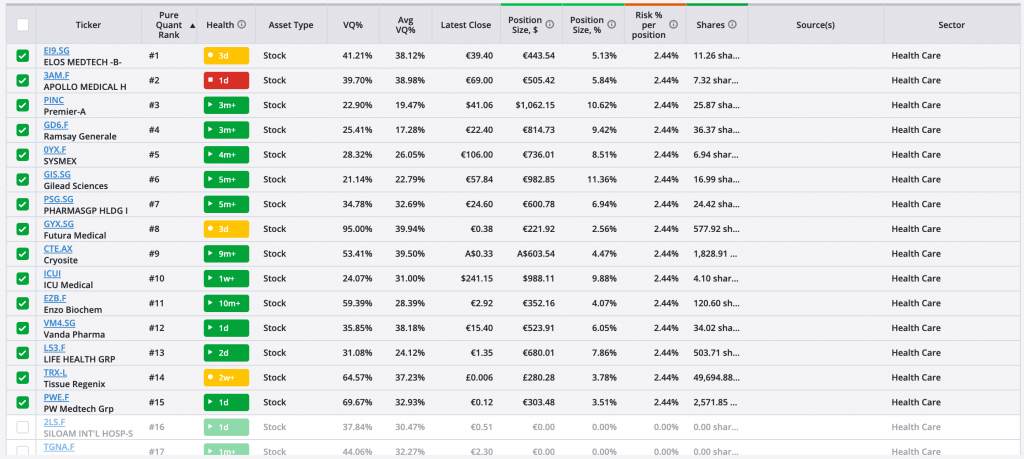
If you'd like to follow along, you can run the Pure Quant tool yourself. Your results may differ from ours, but the general idea will be the same. Here’s what the results page will look like after running Pure Quant.
Note: you can click the image to enlarge it in a new tab
As with most of TradeSmith Finance’s pages, the results page contains a lot of information. We’ll examine it a few columns at a time. Let’s start with the first seven columns and the bottom of the page.

- The green checkmarks and the bottom of the page relate to one another. Your new Pure Quant portfolio will include tickers with green checkmarks. To exclude a ticker, simply uncheck the box. To include a different ticker on the list, simply check the box.
- At the bottom of the page, you can add these tickers to a new or existing portfolio. In our example above, we’d add these tickers to our existing “Bell” portfolio. Keep in mind that these positions cannot be added to synced portfolios.
- The next column is the Ticker symbol. You can click these tickers to be brought to the Analyzer page. This lets you see more information about the position — like its historic performance.
- Next up is the Pure Quant Rank. We previously sorted positions that had spent the least time in the Green Zone; however, we had to find a way to prioritize positions with the same amount of time in the Green Zone. The tool now considers the days since the Entry and the stock’s average volatility quotient.
- The Health Indicator tells you how healthy the position is. Green is good; the position is trading normally based on historical performance. Yellow is cautionary; the position is halfway to stopped out. Red is stopped out.
- Asset Type will tell you the type of Asset. Available Asset Types are: Stocks, Cryptos, Indexes, Forex, Futures, Funds, Commodities, and Warrants.
- The VQ tells you how risky your positions are.
- Below 15% is low risk
- 15 – 30% is medium risk
- 30 – 50% is high risk
- Above 50% is sky-high risk
- The Avg VQ% (or average VQ) tells you the average risk for the position based on years of performance data.
- Let’s look at the next seven columns of data.
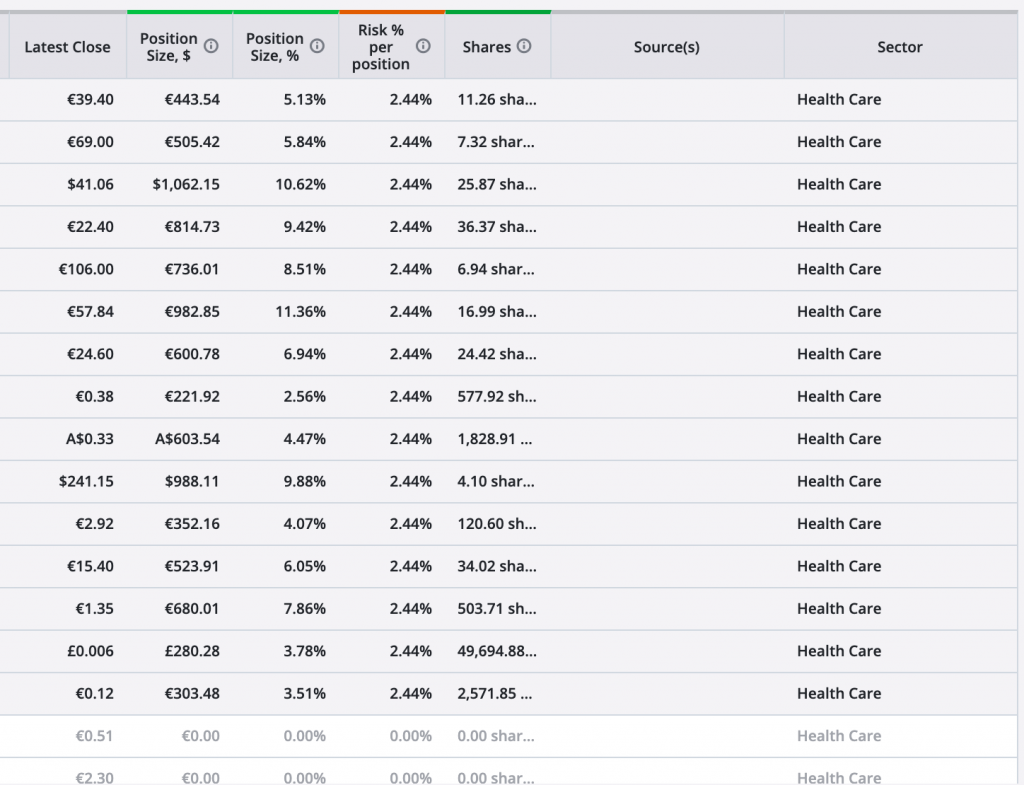
- The Latest Close comes from the market's latest close price. For example, if you run Pure Quant at 1 p.m. on a Tuesday, the Latest Close will be Monday’s close prices for the position.
- Next up is the position sizing information. These columns tell you how much risk you’d take per position and how many shares to purchase. Note how the risk per position is the same as in our example above. This is because Pure Quant will help you take equal risk per position. Typically, we say you want to take 1 – 2% risk per position.
- Our next column is the source(s). This is the source from which the position was pulled. It comes from Step 1 in the Pure Quant setup process.
- The last column is the Sector. This lets you know which sector the position belongs to. In our example above, you can see that some of these say N/A. That’s because cryptocurrencies do not fall into stock sectors, and our Pure Quant results have some cryptos in them.
If you don’t have access to Pure Quant, please call our Dedicated Sales team at 866-220-1107.
*Note—The tabs and features you see on your TradeSmith Finance site will vary based on your subscription(s) and subscription level(s). The pictures in our Education Center articles are taken from a TradeSmith Platinum account.