
The information below was provided by Senior Analyst Mike Burnick.
To read the full Inside TradeSmith article, please click here.
Your One-Stop Shop for Screener Results
Recently, our developers here at TradeSmith launched the all-new Scans page on TradeSmith Finance.
You may have seen it on the platform already on the Invest page – right next to one of my favorite spots, our tried and trusty Screener tab.
But if this is news to you, then you’re in for a treat. Because the Scans feature puts all of your favorite screener results right at your fingertips, updated each and every day.
So today, let me take you on a guided tour – to show you how to make the most of the TradeSmith Scans page, and start accessing a wealth of actionable trading data and signals quickly and easily.
First, log in to TradeSmith Finance to get started. Then from the main Dashboard page, navigate to the Invest page, then click on the Scans tab shown below, right next to the Screener tab:

Clicking that tab takes you to the new TradeSmith Scans page, where you can find a wealth of TradeSmith data all in one convenient place:
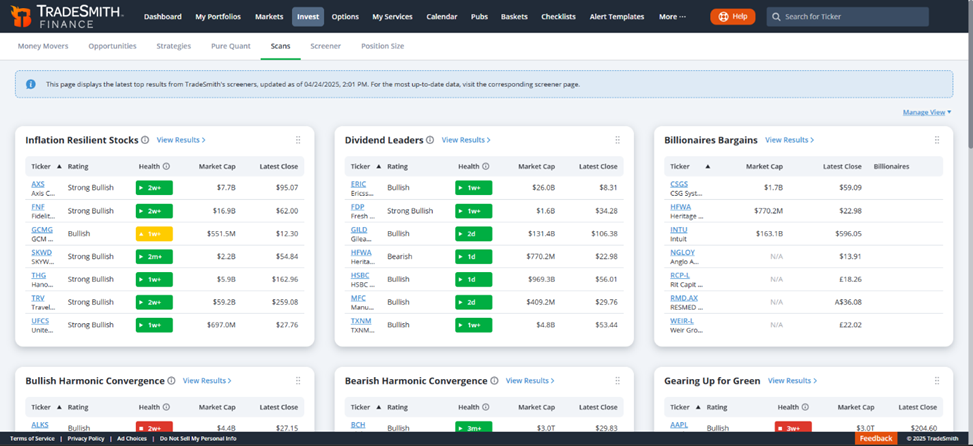
Wow! Lots of data here. But it’s all in one handy spot and easy to scan through in just a few minutes.
The Scans page displays the latest results from our most popular and proven TradeSmith screeners, updated daily.
Plus, you can customize the Scans page as you see fit. Put your most frequently used screens in order of importance and make it your own personal TradeSmith research data dashboard!
Here’s what you’ll see at the top of my own personal Scans page, for example:
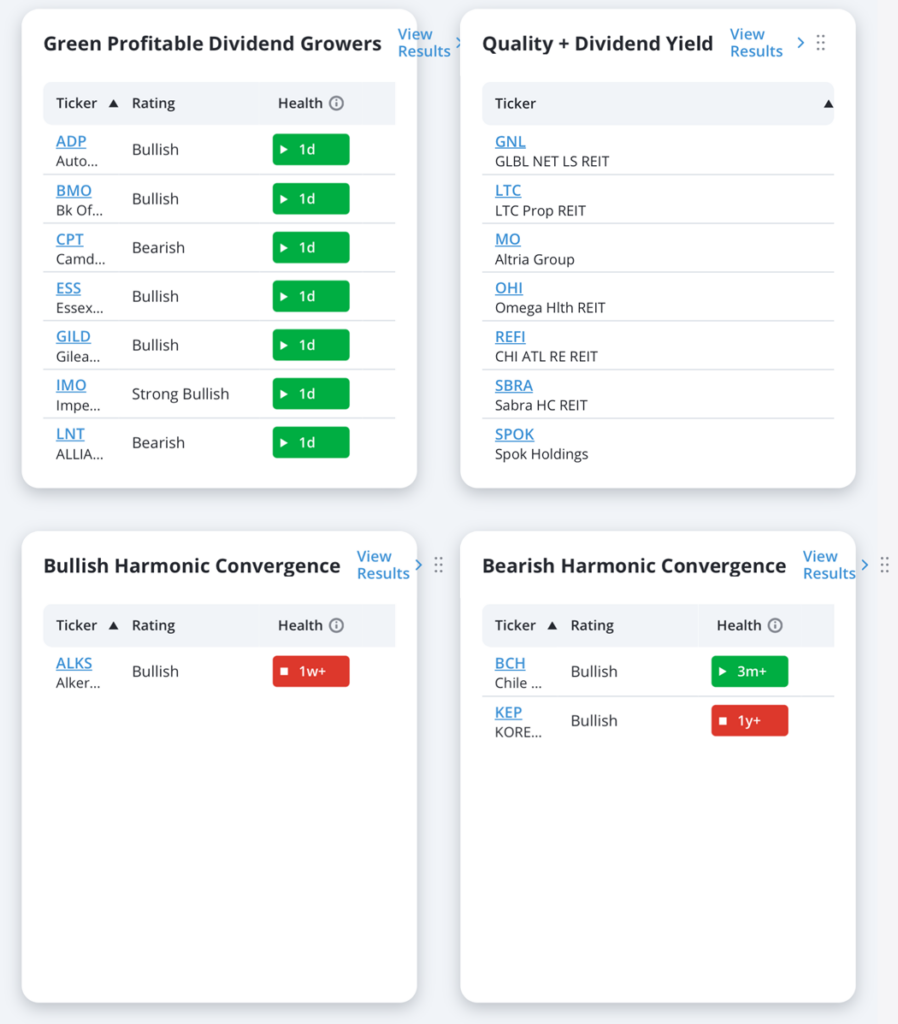
Longtime readers know that I just LOVE dividend-paying stocks. And as shown above, my personal favorite scans are (clockwise from top left):
- Green Zone-Profitable Dividend Growers: This combines our flagship TradeSmith Health Indicator with our Dividend Growth Strategy.
- Quality + Dividend Yield: High Dividend Yields + High Business Quality Scores
- Bullish Harmonic Convergence: To qualify for this screener, stocks must be oversold (Relative Strength Index < 30) and be in a Valley Cycle Turn Area, while having a bullish Seasonality window starting in the next 30 days.
- Bearish Harmonic Convergence: Just turn Bullish upside-down; RSI > 70, Peak Cycle Turn Area, and a bearish Seasonality window within 30 days.
Since I’m a big fan of dividends, I like to cross reference the first two scans to find stocks that may overlap. That means I’m looking for high-quality dividend growers with a high yield in the Green Zone.
Meanwhile, stocks that make the list for Bullish and Bearish Harmonic Convergence screeners are good long or short candidates, respectively.
The screeners available to you on the Scans page will differ based on your subscription level. If you don’t see some of these screeners – and would like to – give us a call at 888-623-0858 to find out more.
And to put your own personal touch on the Scans page, you can show only the scans you use the most by clicking on the Manage button the right as shown below. Plus, you can change the order of screens as you wish, so the results you want to see first are right at the top of the Scans page. Just click the six dots in the corner of the scan tiles and drag-and-drop to rearrange them!
And for the most up-to-date data, you can always visit the corresponding Screener page by simply clicking on the View Results > link, which will take you straight to the latest results from a pre-configured TradeSmith Screener.
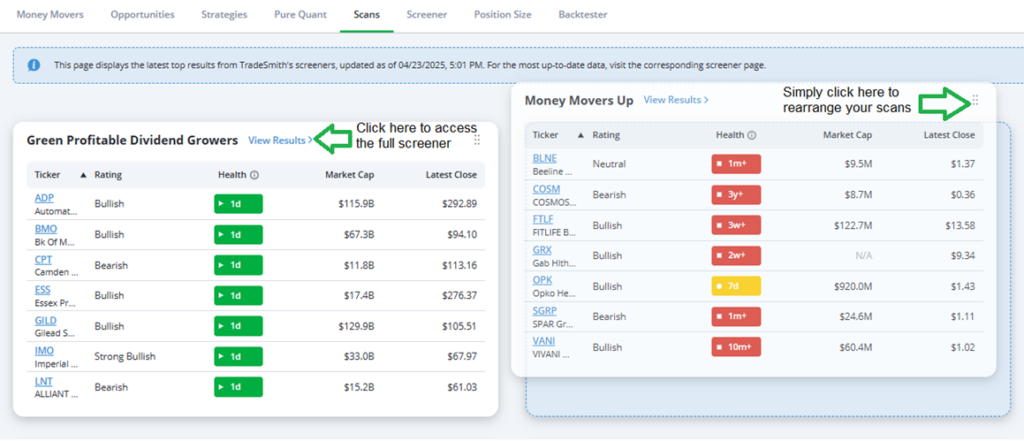
I personally use our TradeSmith Screener more than any other page on the TradeSmith Finance website. So, believe me when I say I’m thrilled to have the Scans page on hand. It’s a quick and easy way to access all my favorite screeners and stocks lists in one convenient and time-saving location.
Good investing,
Mike Burnick
Senior Analyst, TradeSmith